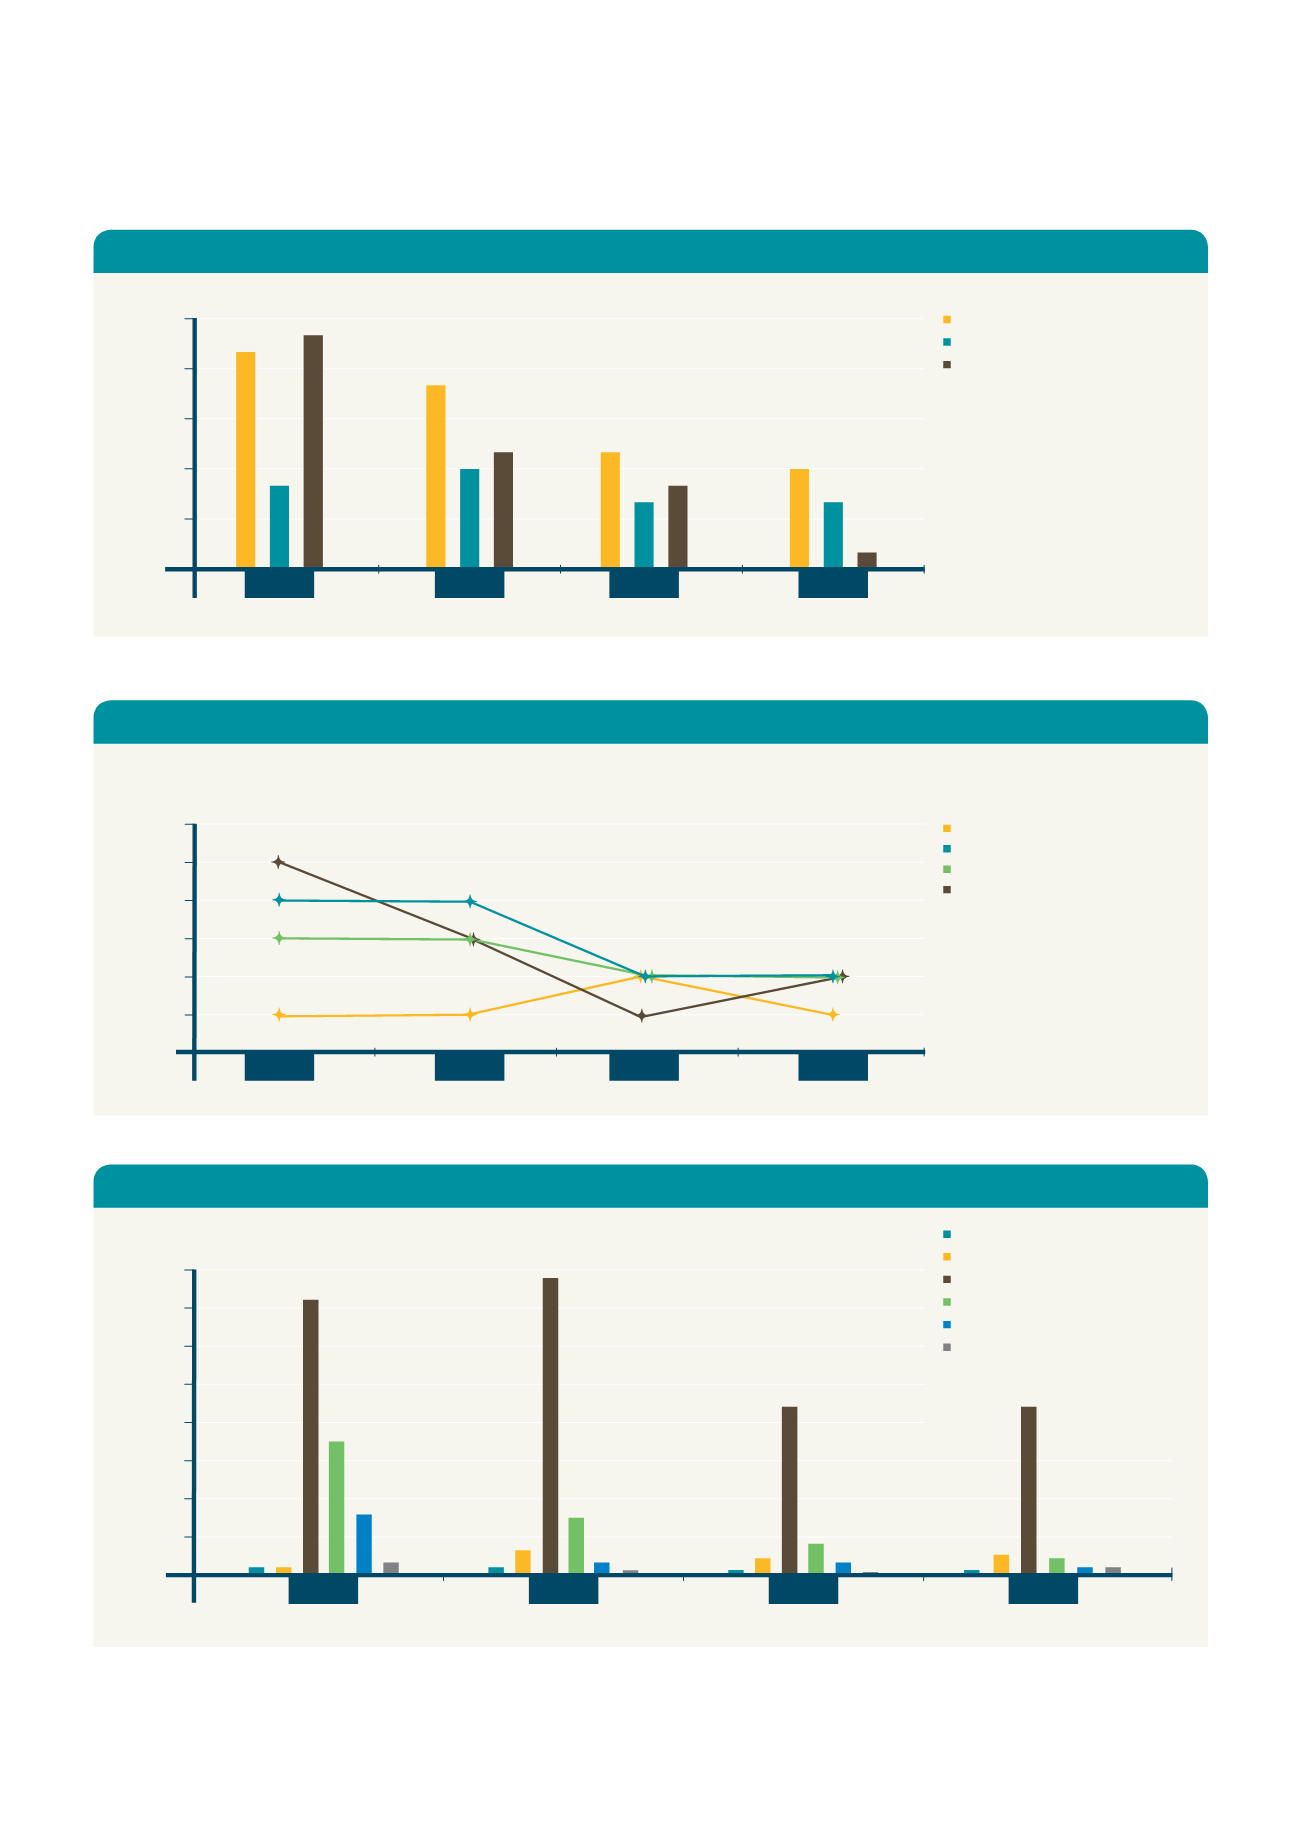
Turnover Highlight (%)
EmployeeTurnover Rate
* 2011 figures calculatedbased on new formula; female leavers/total workforce
** 2011 calculatedbased on new formulas; Seniormanagement &Middlemanagement numbers changedper new grading structure
*** Turnover by Age& Level of Employment is calculatedby category/total workforce
Female Turnover Rate*
Total Turnover Rate
UnplannedTurnover Rate
2008
2009
2010
2011
3
6
9
12
15
13
14
7
5
1
5
6
4
4
11
7
6
Turnover by Age (%)***
41 - 50
51 - 60+
18 - 30
31 - 40
1
2008
2009
2010
2011
1
1
1
1
2
3
4
5
6
2
2
2
2
5
4
4
3
2
3
2
3
Turnover Level of Employment (%)***
1
2
3
4
5
6
7
8
SeniorManagement**
MiddleManagement**
Staff
ServiceContractors
Secondees
Special Contracts
0.2
3.5
1.6
0.3
7.3
0.6
1.5
0.3
0.1
7.8
0.3
0
4.9
0.5
0.1
0.4
0.2
0.2
4.9
2009
2011
0.4
0.1
0.8
2010
0.2
0.2
2008


