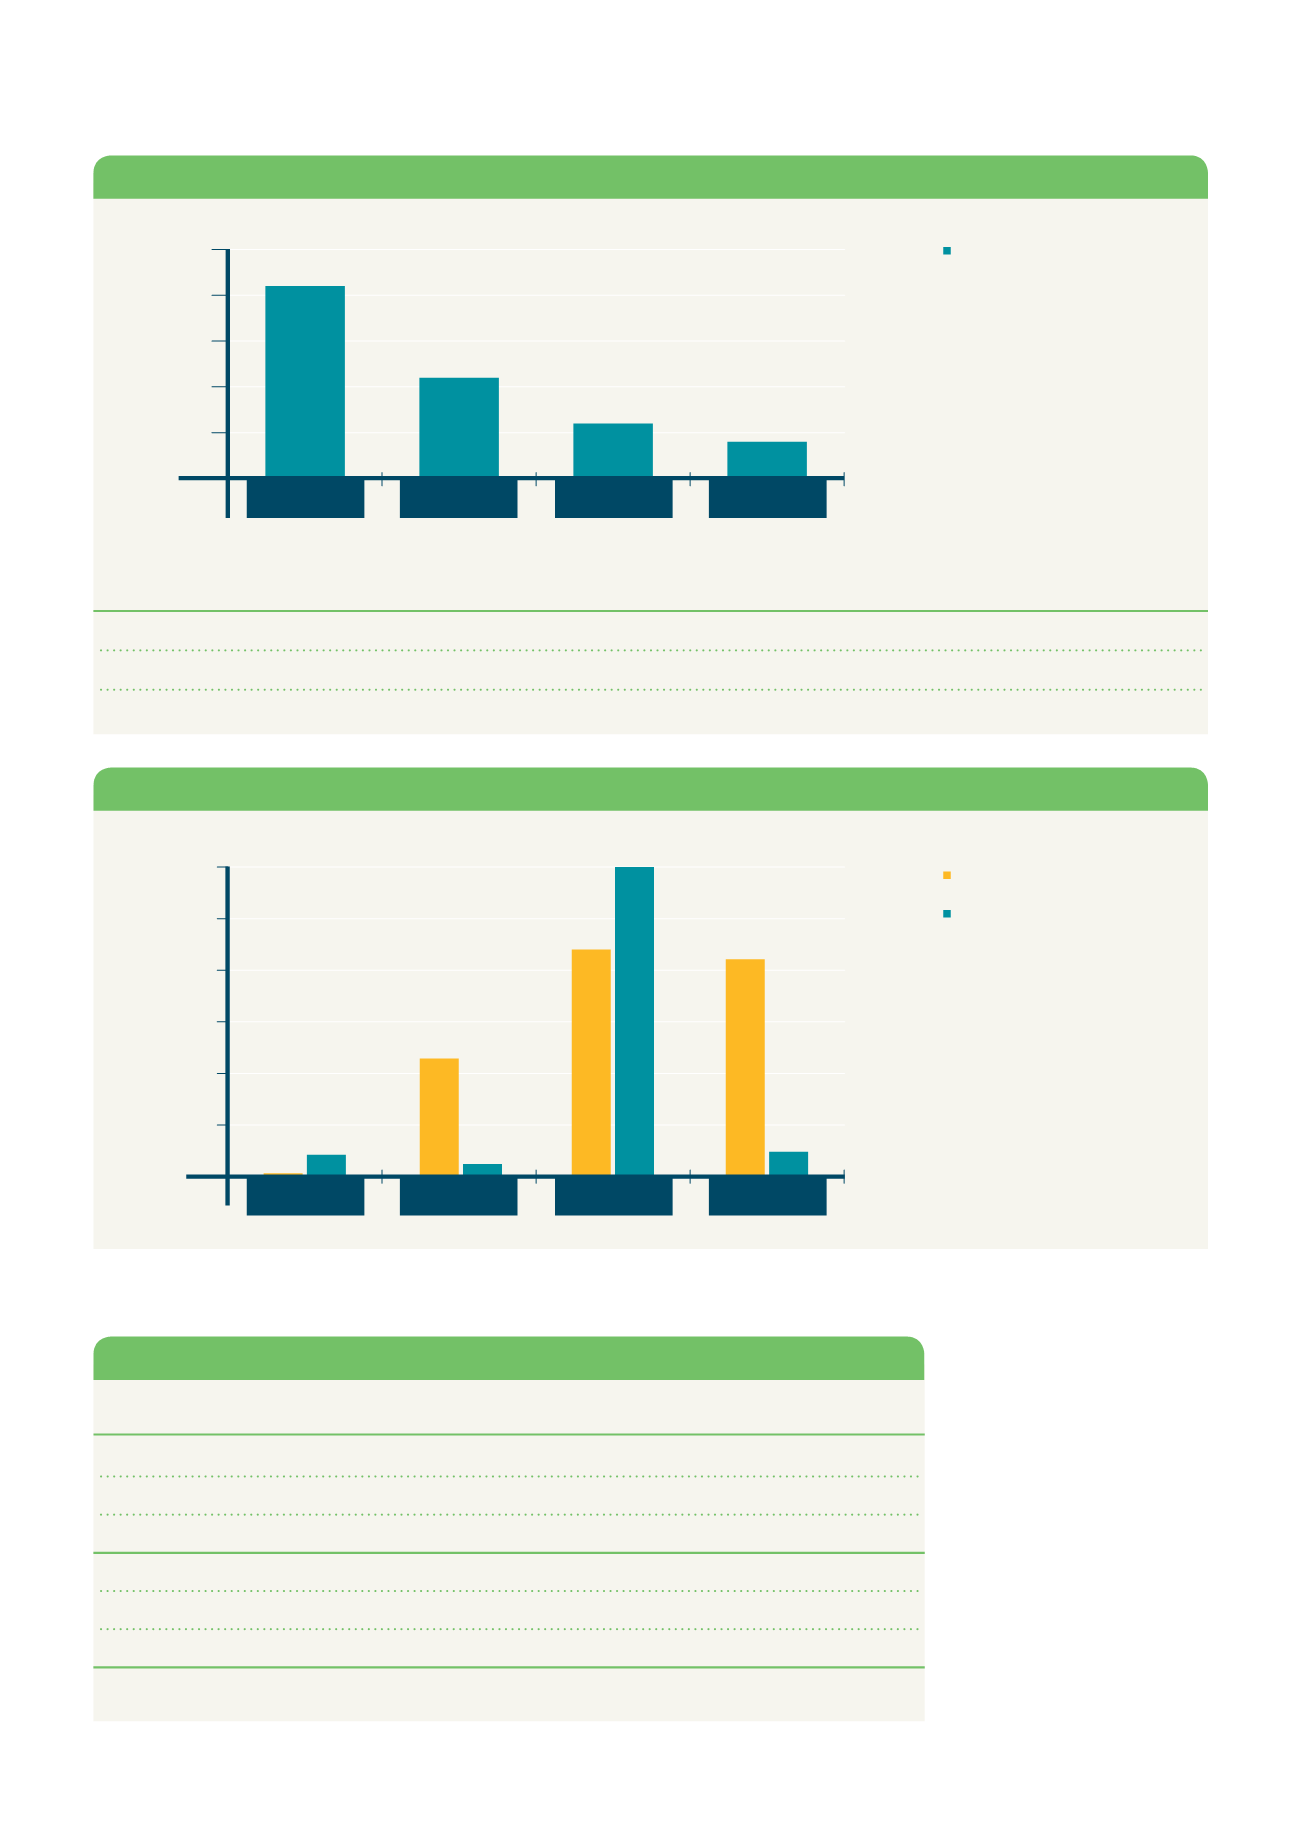
Emissions from Flaring (Qatar)
0.5
1.0
1.5
2.5
2.0
2009
2010
2011
2008
2.1
1.1
0.6
0.4
Flaring as aPercentage
of Gas Available for Sale
Flaring (MMscf)
Volume of Onshore Flaring
Volume of Offshore Flaring
2008
2009
2010
2011
15,288
14,830
458
3,685
3,344
341
4,846
4,489
357
8,648
8,227
421
Venting (MMscf) - UAE*
Total Air Emissions - Tons*
NO
x
Qatar
UAE
SO
x
Qatar
UAE
Total AirEmissions
2008
2009
2010
2011
3,246
3,234
12
33
32
<1
3,279
741
737
4
245
244
<1
986
579
572
7
258
257
<1
837
3,072
3,062
10
31
30
<1
4,003
* Numbers fromprevious years have been updated
* Ventingof natural gas is done to clear the pipeline for routinemaintenancework
Venting alongUAEGas
Network (MMscf)
Venting at Taweelah
Receiving Facility (MMscf)
5
10
15
20
25
30
0.24
11.44
2.13
1.23
22.00
30.00
21.07
2.41
2009
2010
2011
2008


