‘‘
DolphinEnergy
measures its
safetyperformance
by adoptinga
number of leading
and lagging
keyperformance
indicators.
’’
EmployeeHealth andSafety
Health, safety and security of our workforce (both employees and
contractors) is a top commitment for DolphinEnergy. Dolphinhas
establishedpart of our businessHealth andSafety systems bywhich
risks areproperly identified, analyzed and assessed. As a result,
risks are either eliminatedor reduced to acceptable levels.
In 2010, a “SecurityProceduresManual”was developed, specific to
theUAE, and the corresponding awareness campaign is expected to
be completed in 2011. In 2010, DolphinEnergy decidednot tomove
forwardwithdeveloping and launching anHSE leadership training
programupon conducting abasic feasibility assessment.
DolphinEnergy continues its ‘zero fatalities’ record into the company’s
10th year of operations.
As one of the leading companies in the energy sector, DolphinEnergy
measures its safety performanceby adopting a number of leading and
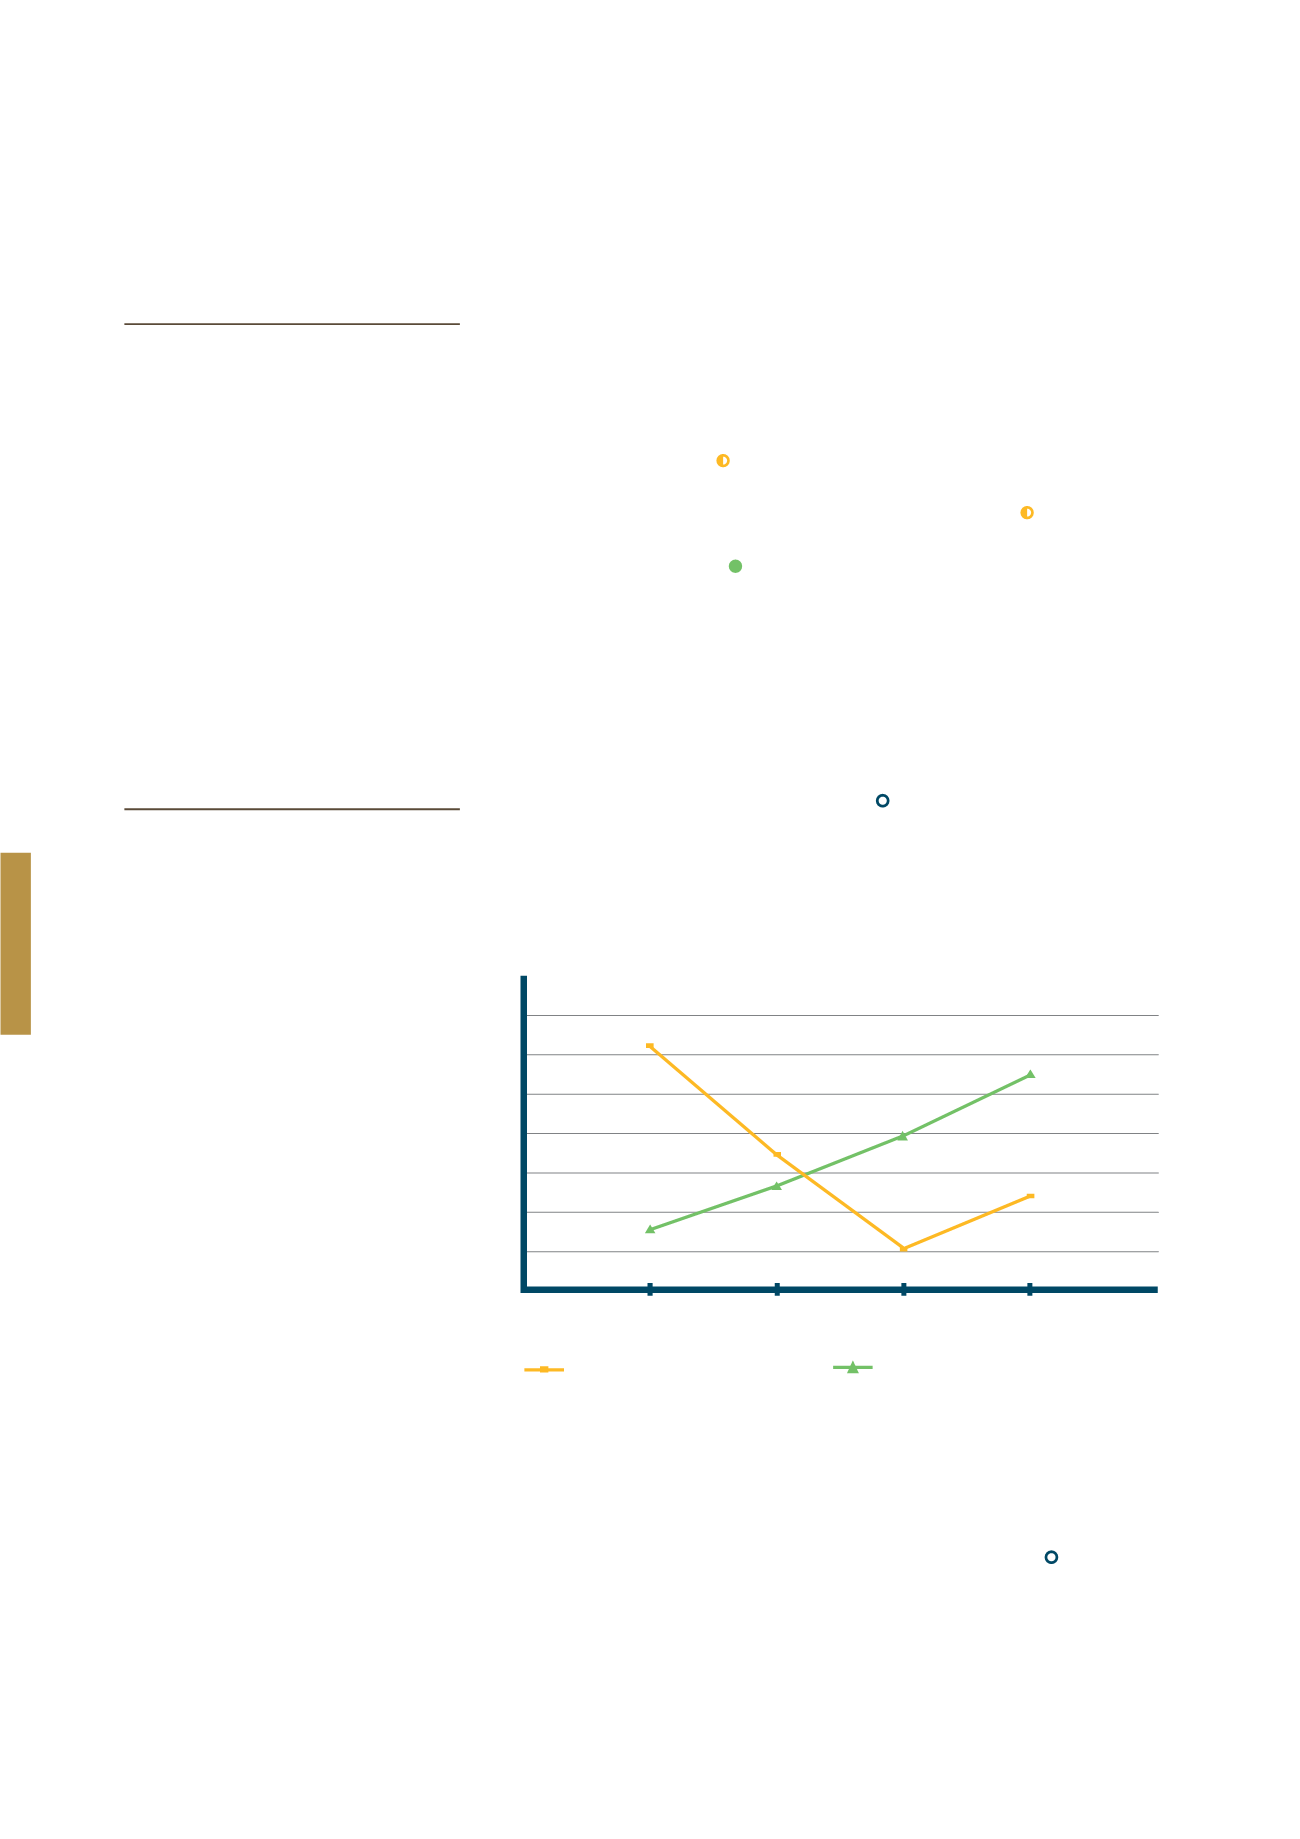
lagging key performance indicators. A keymeasurement within safety
involves recording the total number of injury or illness-related incidents
that the company experiences permillion hoursworked – the Total
Recordable Incident Rate (TRIR). DolphinEnergy saw increases in its
TRIR rates in 2010due toone accident causedby a contractor onour
TaweelahFujeirahPipeline (TFP) Project; DolphinEnergy took various
steps to improve the contractor’sH&Sperformancewhichproved tobe
successful (see the TFP case study onpage 39 formore information).
Additionally, DolphinEnergy records the Lost Time Incident Rate (LTIR)
which tracks the number of incidents that result in a lost time injury or
illness permillion hoursworked. The 2010 LTIR rates also saw an increase
fromprevious years. Employee LTIR increasedmarginally from0 in2009
to 0.30 in 2010, andLTIR for contractors increasedby 78%. LTIR rates
saw an increase in 2010 for the same reason the TRIR rates increased in
2010 (see TRIR section above).
Total Recordable InjuryRates (TRIR)
2007
0
0.5
1
1.5
2
2.5
3
3.5
2008
2009
2010
TRIREmployees
TRIRContractors
3.11
1.72
1.21
0.54
2.75
1.98
1.29
0.79


