Sustainability
Issues
Indicator
Performance
2010
Target
2010
Comp
2007
2008
2009
2010
Good
Governance,
Management
and Integrity
Numberof regulatory incidents
0
0
0
0
0
Percentageof independentdirectors
89% 89% 89% 89% 89%
LevelofGRI-based reporting
NI
NI
NI
A
A
Numberstakeholdergroupsassessing report
NI
NI
NI
1
NT NT
Providing
Cleaner Energy
andOptimizing
By-products
ExportofLeanGas (BCF)
135
701
728
730
730
Condensate (MMbbls)
7.4
35.1
35.6
35
36 98%
Propane (kt)
98
781
813
818
836 98%
Butane (kt)
72
482
496
501
506 99%
ExportEthane toQP (kt)
125
1,124
1,296
1,321 1,296
Sulfur (kt)
8
232
252
260
256
Meetingand
Exceeding
Customer
Expectations
Numberofunplannedsupplydisruptions tocustomers
0
0
1
0
0
Customersatisfaction index
NI
NI
NI
6.9
Develop
index
Ensuring
Efficient
Operations
TRFDowntime (hours)
NR*
0
0
0
0
Availabilityof facilitiesdue tonon-operational
shortfalls (%)
NR
NR 99.56% 98.17% >95%
Ratioofcorrective topreventativemaintenance-
RasLaffan
NR
0.9
1.42
1.36
1.25
Correctivemaintenanceasapercentage
of total -Taweelah
NR 19.80% 25.67% 32.25% 55%
Creating
Economic
Opportunity
Netsales revenues (USDmillions)^
381,185 1,450,373 1,576,149 1,874,258 NT NT
Amountpaid tohuman resources (USDmillions)^^
22,214 33,419 36,861 37,972 NT NT
Amountspenton localcontracting (USDmillions)
NI
NI
NI
$402.3 NT NT
Minimizing
Environmental
Impacts
Flaring- totalvolumeflared (MMscf)
25,806 15,288
8,648
4,846
NT NT
OnshoreFlaring-percentageofavailablegas forsale
19% 2.1% 1.1% 0.59% 0.3%
NOxemissions (tons)
903
3,246
3,072
572
NT NT
SOxemissions (tons)
11
33
31
257
NT NT
GHGemissions (kt)
2,228.3 3,688.3 3,362.1 3,014.9 NT NT
Community
Engagement
andOptimizing
Social Impacts
Number of local communityengagements**
7
20
17
23
NT NT
Percentageof profit invested incommunity
1.2% 0.85% 1.2% 1.2% >1%
BeingEmployer
ofChoice
PercentageEmiratization
37% 34% 34% 45% 47%
PercentageQatarization
12% 18% 22% 27% 27%
Percentageof Female -Total Employees
12% 11% 13% 14% 20%
Percentageof Female -Management
0% 3.6% 4.4% 4.1% 6%
Percentageunplanned turnover (%ofworkforce)
8% 5% 6% 4% <8%
Percentageabsenteeism
0
0
0
0
0
Employeesatisfaction index (%)***
NR
72% NR
73% 72%
Employeesatisfactionwithqualityof engagement
withmanagement***
NR
72% NR
74% 72%
Percentageemployeeshavingperformance reviews
37% 88% 93% 100% 100%
Youth internshipsoffered
28
30
23
19
40
EnsuringSafe
Operations
Fatalities
0
0
0
0
0
TRIREmployees
3.11
1.72
0.54
1.21
1.8
TRIRContractors
2.01
1.96
1.98
2.76
1.8
LTIREmployees
2.22
0.43
0
0.30
0.5
LTIRContractors
0.61
0.61
1.13
2.01
0.5
Contractor
andSupplier
Relationsand
Practices
Number of reviewsandchecks for contractor
compliance
NR
NR
NR
22
NT NT
SummarySustainabilityPerformance
NR: Not Recorded; NT: NoTarget; NI: New Indicators
*The customer satisfaction survey is out of 10; ** excluding environmental programs; *** survey only conducted every two years;
^ In the 2009 report, revenues reportedwereNet Sales (i.e net of cost of sales), which has nowbeen reinstated for all the years from
2007onwards to report actual revenues and the cost of sales are reported as part of operating costs tobe in linewith theGRI
indicator protocols set inEC1; revenues pertainonly todownstreamoperations;
^^This constitutes amount spent ondownstreamoperations, and excludes amount spent for secondees and services contractors
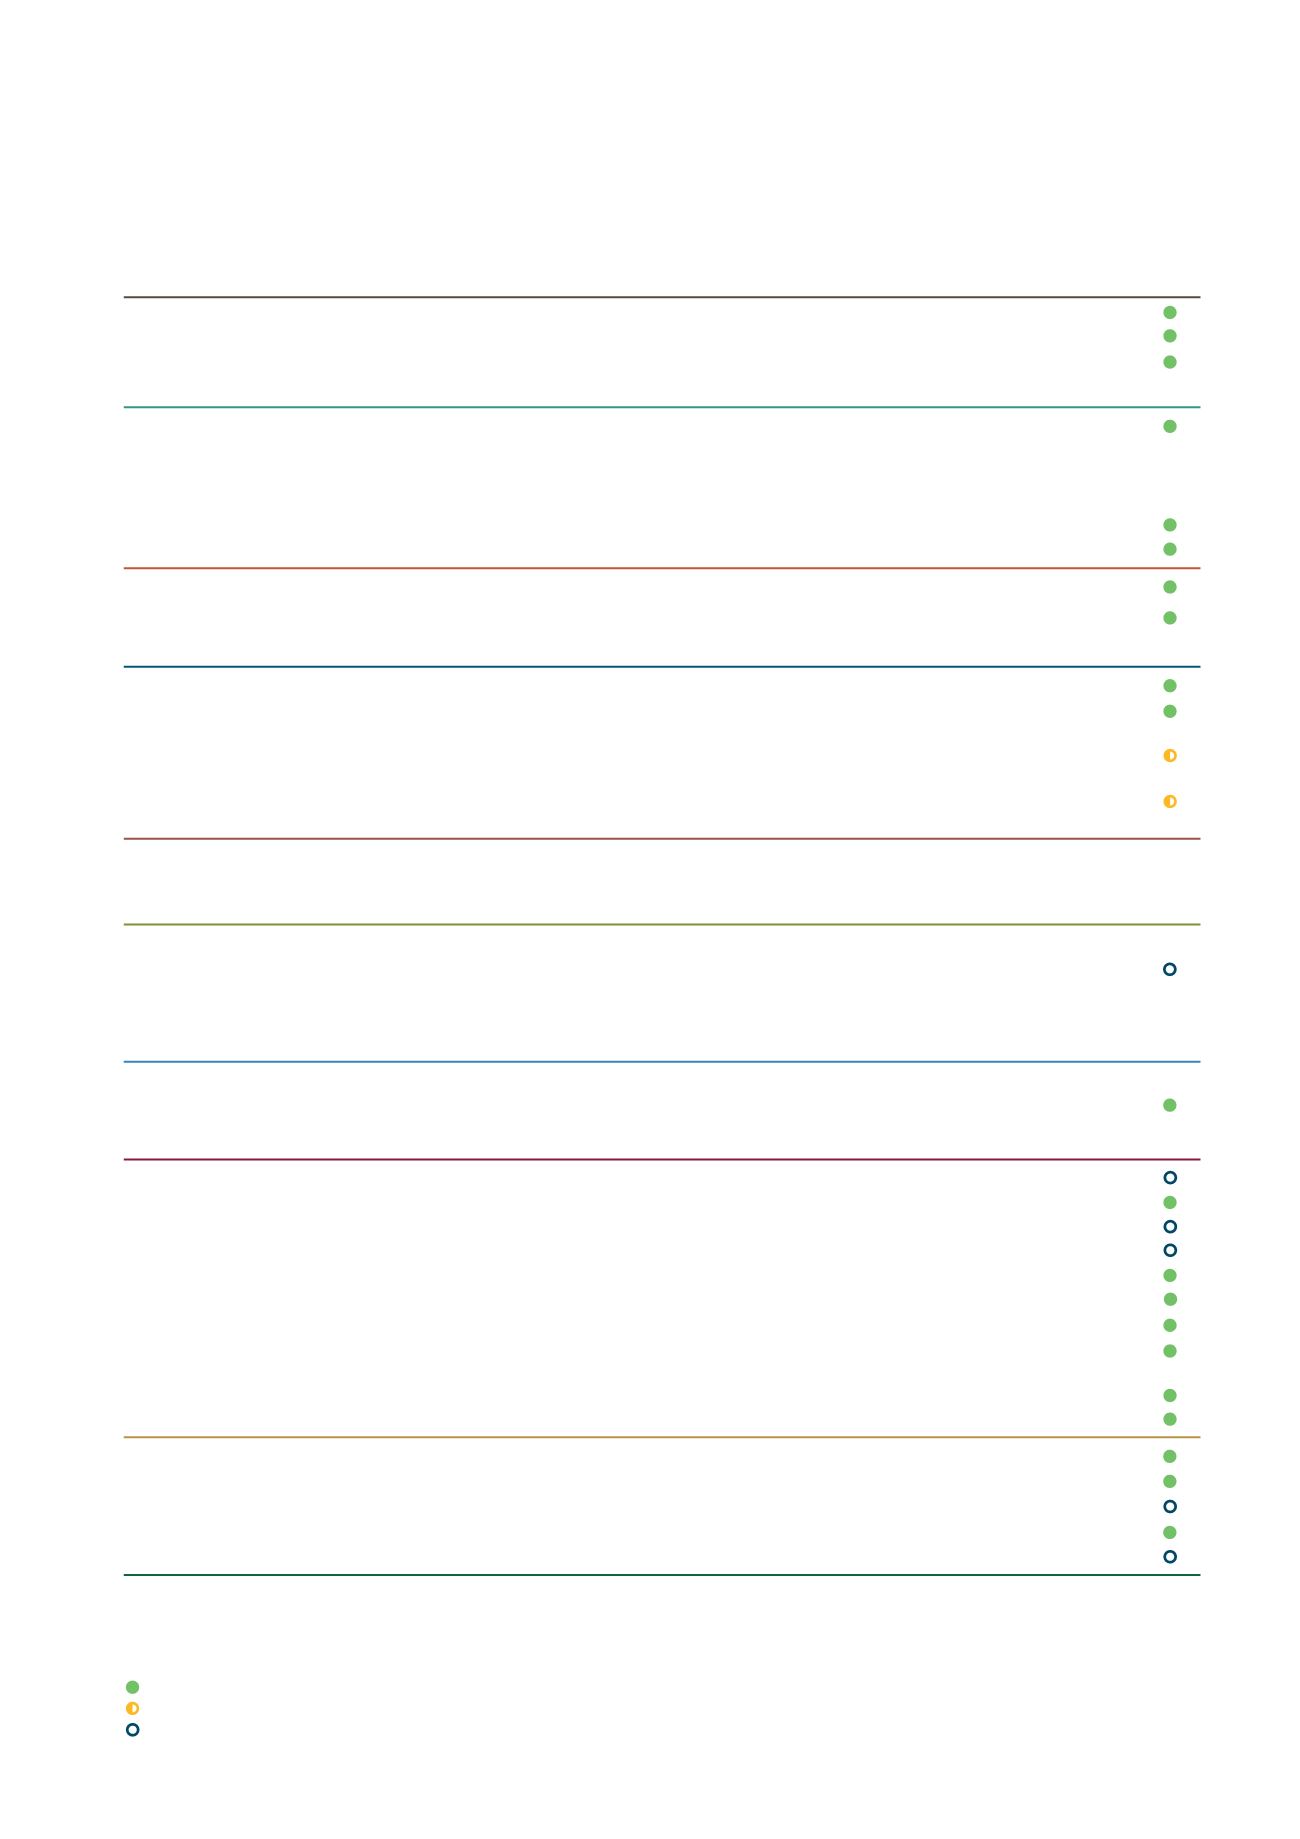
DolphinEnergy backs up its commitments topriority areaswith clear objectives andperformance tracking.
Below is a summary of performance. Details canbe found in the relevant sections of this report.
Complete
Work inprogress
Not achieved


